Quantcast
Channel: Statalist
Viewing all 65609 articles
Browse latest View live

Dynamic panel model with lagged effects of x on Y

$
0
0
I have dynamic panel data (countries=27 and t=21) with dependent variable (Y) and the independent variables of X1, X2, X3 and the lagged dependent variable. The independent variables have an impact on Y a year later.

The estimating regression will then look as follows:

Yt = aYt-1 + bXit-1 + ct+ dt +et, where c, d and e are the country specific effects, time dummies and unobserved eeror term respectively.

Is it possible to include the lagged effect in a system-GMM estimator?

Biprobit postestimation predicted probability table using esttab command

$
0
0
Hi,

I am using biprobit command and then trying to estimate joint probabilities. However, when I try to esttab the joint probabilities, I am getting the coefficients, not the probabilities.

I saw some posts and suggestions using mfx command but it is no longer part of stata. Here is the example of what I am doing:


biprobit depvar1 depvar2 indepvar1 indepvar2 indepvar3
estimates store biprob
predict biprob11, p11
estimates store biprob11
esttab biprob11 using "biprob11.rtf", append cells(b(star fmt(%9.3f)) se(par fmt(%9.3f))) scalars (ll chi2 df_m p chi2_exog p_exog) legend compress collabels(none)

--------------------
Using the above code I am getting the coefficients of biprobit and not the joint probabilities. I read online that I should use the 'post' command but I am not sure how to incorporate it in the predict code. Can somebody please help? Thank you for your time.

Create new variable based small value among two existing variables

$
0
0
Hello,

I would like to generate new variable by choosing a small value between two existing variables. For example, given that there exists two variables, A and B, I would like to generate new variable C by selecting smaller values between A and B.


Year A B C
1990 1 3 1
1991 2 -1 -1
1992 0 2 0
1993 -1 -3 -3


I tried to search "if else" command using "gen" command, but I could not find a proper solution to solve this problem.
Due to different signs of each value, subtracting or summing does not help to discern which value is larger or smaller.
Any advice and tip would be helpful!


Thank you


Create a new shapefile from another

$
0
0
Hi,

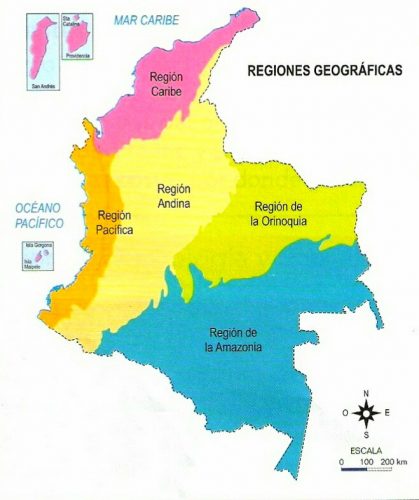
I'm currently working with some data at a "state"(Different nomenclature in my country) and regional level for my country (Colombia) that I want to graph in a map. I searched for a shapefile for my country and was surprised by the amount of shapefiles available for Colombia that state institutions provide, anyway I need a shapefile with the regional division for my country and the problem is that I have searched and I can not seem to find this shapefile, and the institution that provides this data are currently unable to provide me with one (thats what they say).

I do have the shapefile with the state division which contains all states and from this I thought I could join different states to form the regions that I need in a new shapefile so I was hoping if you could tell me if there is a way to do this in Stata?

Thank you for your time and help. I attached two images to help you visualize what I want to do.

what I currently have in a shapefile:


What Im aiming to create in a new shapefile from the one above:


how to main the figure's relative position to the frame when turning the legend on and off

$
0
0
Hi, there,

I got an issue when trying to turn legend off. I made some figures with legend, I also need to make other figures without legend. But, when you turned legend off, the relative position of the figure to the frame changed, i.e. the figure become bigger than that with legend. I was trying to keep the legend and make it transparent so that the relative position remains the same, but haven't succeeded.
My question is how to remain the figure's relative position to the frame when turning the legend on and off.
Thanks!

Econometric Model

$
0
0
Hey everyone!

So, I am researching the effect of subcontracting on economic recovery (using GDP by geographic location as a measure of "recovery"). I do not have panel data and a logit model just seems too simple. Does anyone have any suggestions for an econometric model that I might be able to use?

Thanks!

Coefficient of Categorical Variable

$
0
0
As I am trying to conduct a regional study, I have taken the country dummy to check the influence of country differences on the dependent variable.

I have found that differences among the countries are significant to explain the variation in the dependent variable.

For 7 countries, I have 6 coefficients and associated test statistics for the country dummy variable.

Question is that which final coefficient I have to report in my final output as the coefficient for the country?

Array

Single imputation

$
0
0
Hi experts,

I try to use Stata to conduct single imputation for three variables. Two are continuous and one is binary. I chose single imputation because previous literature suggests so.
I intend to use mi impute to conduct single imputation, because I cannot find any online resource on using Stata to do single imputation. All are about multiple imputation.
I read that we need to impute multiple variables simultaneously, so I chose mi impute chained, because this is the only version of mi impute that seems to me to allow for imputing continuous and binary variables simultaneously. So my question is I want to know if the syntax I wrote as below is correct or not.

mi set wide
mi register imputed var1 var2 var3 // var1 and var2 are continuous; var3 is binary
set seed 181123
#delimit ;
mi impute chained (pmm,knn(5)) var1 var2 (logit) var3 = depvar indepvars, add(1);
#delimit cr

Two potential issues:
Am I correct in using add(1) in mi impute if my intention is to use mi impute to do single imputation? Or should I first produce, say 20 datasets (add(20)), and then take the average of them on var1, var2, and var3?
Am I correct in relying on mi impute chained in performing single imputation for continuous and categorical variables simultaneously?

I know my question is awkward. Many thanks in advance for any advice!

Ordinal logistic with Panel data and violation of the proportional odds assumption

$
0
0
Hi,
I have ordinal data with repeated measurements and I would like to fit a random effects model but the PO assumption does not hold.
Is there a way to fit such a model in Stata?
Thank you,
Nikos

Matching components of string variables

$
0
0
I have data from a trial where a patient answers a set of questions in the sequence q12, q14, q16 and q18. There can be upto 7 answers for the question. The restriction is that if a response appears in q12 then it cannot appear in q14-q18, and if answered in q14 it cannot appear in q16-q18 etc. Unfortunately some patients ignored this and there is repeated data.

Code:
* Example generated by -dataex-. To install: ssc install dataex

clear

input str171 q12m str155 q14m str171(q16m q18m)

`""g","a""'     `""e""'         `""g","a""'     `""g","c","a""'

`""g","c","a""' `""g","c","a""' `""g","c","a""' `""g","c","a""'

`""g","a""'     `""g","a""'     `""g","a""'     `""g","a""'    

`""g","a""'     `""g","a""'     `""g","a""'     `""g","a""'    

`""g","c""'     `""e""'         `""g","a""'     `""g","a""'    

`""g","a""'     `""g","a""'     `""g","a""'     `""g","a""'    

`""g","a""'     `""g","a""'     `""g","a""'     `""g","b""'    

`""g","a""'     `""g","a""'     `""g","a""'     `""g","a""'    

`""g","a""'     `""g","a""'     `""g","a""'     `""g","a""'    

`""g","a""'     `""g","a""'     `""g","a""'     `""g","a""'    

`""g","a""'     `""g","a""'     `""g","a""'     `""g","a""'    

`""g","a""'     `""g","a""'     `""g","a""'     `""g","a""'    

`""g","a""'     `""g","a""'     `""g","a""'     `""g","a""'    

`""g","c""'     `""g","a""'     `""g","a""'     `""g","a""'    

`""g","a""'     `""e""'         `""e""'         `""g","a""'    

`""g","a""'     `""e""'         `""g","a""'     `""g","a""'    

`""g","a""'     `""e""'         `""g","a""'     `""g","a""'    

`""g","a""'     `""e""'         `""g","a""'     `""g","a""'    

`""g","a""'     `""e""'         `""e""'         `""g","a""'    

`""g","a""'     `""e""'         `""e""'         `""g","a""'    

end
What I am attempting to do is to eliminate the repeated response such that line 1 would become:

Code:
  +-------------------------------------------------------+

     |        q12m          q14m          q16m          q18m |

     |-------------------------------------------------------|

  1. |     "g","a"           "e"       " "," "   " ","c"," " |

I thought that I might be able to achieve this with inlist:

Code:
replace q14m = "" if inlist(q14m,q12m)
replace q16m = "" if inlist(q16m,q12m)
replace q18m = "" if inlist(q18m,q12m)
but this only matches exact cases.
Code:
-----------------------------------------------+

     |        q12m      q14m      q16m          q18m |

     |-----------------------------------------------|

  1. |     "g","a"       "e"             "g","c","a" |

  2. | "g","c","a"                                   |
I would be grateful for some advice on how to solve this problem.

Martyn


Time-varying Covariate with Competing Risks

$
0
0
Hello,

I have to study the relationship between a drug exposure and outcomes, adjusting for other covariates.
For each subject the drug concentration was recorded once a month as a continuous value. This concentration may vary over time.
There are two possible competing Outcomes:
subject Month#1 Month#2 Month#n Outcome
1 160 240 240 0 (Censored)
2 360 340 360 1 (Event of Interest)
3 240 180 180 2 (Competing Event)
I tried the stcox solution (https://www.stata.com/support/faqs/s...ate-cox-model/) but Cox treat competing events as censored.
I would appreciate any sugestions.
Thanks in advance !

An error "plugin not loaded or not available: use the adoonly option" accur after "ml maximize"

$
0
0
I am trying to learn how to use mdraws by Cappellari and Jenkins.When replicating the example test_trial_dta_100.do,an error accuered after the step ml maximize. the code as blow: *! version 1.0.0 27apr2006 clear all set more off cap log close * cd d:\home\stephenj\MYProjects\cappellari\egen\plugin \sj3 // cd log using test_trial_dta_100.log,replace ********* test_trial_dta_100 ********************** * * Three binary outcomes, one of which is incidentally truncated * * 100 halton draws, with antithetics * ************************************************** * which _gmvnp which mdraws use trial ta lph20 flph20, missing // gets initial values quietly{ probit retent1 female eta eta2 mat b1 = get(_b) mat coleq b1 = retent1 // Reset column names of matrix probit lph20 female eta eta2 mat b2 = get(_b) mat coleq b2 = lph20 probit flph20 female eta eta2 mat b3 = get(_b) mat coleq b3 = flph20 mat b0 = b1, b2, b3 } ********************** * PLUGIN & antithetics ********************** set rmsg on //Return messages mdraws, dr(100) neq(3) prefix(z) burn(10) antithetics set rmsg off global dr = r(n_draws) capture program drop myll program define myll args lnf x1 x2 x3 c21 c31 c32 tempvar sp2 sp3 k1 k2 k3 quietly { gen double `k1' = 2*$ML_y1 - 1 gen double `k2' = 2*$ML_y2 - 1 gen double `k3' = 2*$ML_y3 - 1 tempname cf21 cf22 cf31 cf32 cf33 C1 C2 su `c21', meanonly scalar `cf21' = r(mean) su `c31', meanonly scalar `cf31' = r(mean) su `c32', meanonly scalar `cf32' = r(mean) // constraints on diagonal elements scalar `cf22' = sqrt( 1 - `cf21'^2 ) scalar `cf33' = sqrt( 1 - `cf31'^2 - `cf32'^2 ) mat `C1' = (1, 0 , 0 \ `cf21', `cf22', 0 \ `cf31' , `cf32' , `cf33') mat `C2' = (1, 0 \ `cf21', `cf22') egen `sp3' = mvnp(`x1' `x2' `x3') if $ML_y1==1, /// chol(`C1') dr($dr) prefix(z) signs(`k1' `k2' `k3') egen `sp2' = mvnp(`x1' `x2' ) if $ML_y1==0, /// chol(`C2') dr($dr) prefix(z) signs(`k1' `k2') replace `lnf'= ln(`sp3') if $ML_y1==1 replace `lnf'= ln(`sp2') if $ML_y1==0 } end ml model lf myll (retent1: retent1 = female eta eta2) /// (lph20: lph20 = female eta eta2) /// (flph20: flph20 = female eta eta2) /// /c21 /c31 /c32 /// , missing title("3-var probit, 1 selection, MSL, $dr Halton draws") ml init b0 set rmsg on ml maximize set rmsg off everything is fine until: . ml maximize plugin not loaded or not available: use the adoonly option
Anyone can help me understand why this happen?Thanks a lot.

Rank individual with characteristic A against members with characteristic B

$
0
0
Hi,

I am unsure of how to write code for the following situation. I have a data set of students nested in classes. I would like to rank each male student in each class against the female students in the class (but not against all the students in the class). I would like to rank them using "math score". In other words, in Class A, I want to rank Bob's math score against Allie, Kim, and Sally but not against, say, Sam and Joe. I would like to loop through the entire dataset and do this for each male student.

I am using Stata version 15.1 on Windows 10.

Best wishes and many thanks in advance,

Prashant Loyalka
Assistant Professor
Stanford University

What kind of studies need to use fpc? Enumerative versus analytical studies

$
0
0
Hi everybody

I am using the large household survey (GEIH) conducted by the DANE in Colombia (with around 60.000 observations). This is a survey by probabilistic sampling, multistage, stratified, of unequal conglomerates and self-weighting.

My objective is to analyse some of the determinants of the labor satisfaction (with a binary response). My doubt is if I should use the survey command with fpc or can I run a probit arguing that the study is analytical and not enumerative?

I would really appreciate your answer.

Convert blood pressure data from string to numeric

$
0
0
I have an issue with STATA where I am not able to successfully convert blood pressure string variable (ex. 120/80) into numeric?

Heckprob: convergence not achieved

$
0
0
Hi everybody

I have a problem with a heckprobit model. It runs perfect if i don´t consider one variable (age*age that is P60402) in the selection ecuacion; but if i include this variable then i have the error message: convergence not achieved (even using difficult). I wouldn´t like to eliminate this variable because the theory behind is very strong so, what can i do to avoid that solution?

This is the model:

heckprobit Y i.P6020 P6040 P60402 LOGP6800 i. P6070COPY LOGINGLABO i.P6220COPY i.P7020COPY i.P6430COPY P6426 P64262 i.P515COPY i.P514COPY i.P6870COPY i.P6880COPY2 [pw= fex_c_2011] , select (pea= i.P6020 ESC ESC2 P6040 P60402 P6070 INGRESTOFLIAPERC P6050COPY P6020#HIJOSMENORES) vce(robust) difficult

Thanks

¿Is it possible to run a Heckprob using the comand for surveys?

$
0
0
Hi everybody

I am working on a heckprob model but the data is from the large household survey (GEIH) conducted by the DANE in Colombia (with around 60.000 observations). This is a survey by probabilistic sampling, multistage, stratified, of unequal conglomerates and self-weighting. How can I use run a heckprob model with the command of svy?

gather countries together?

$
0
0
Dear All, I have the following data
Code:
* Example generated by -dataex-. To install: ssc install dataex
clear
input float id str12 country str32 all
1 "Singapore" "SingaporeThailandSingaporeBurma" 
1 "Thailand"  "SingaporeThailandSingaporeBurma" 
1 "Singapore" "SingaporeThailandSingaporeBurma" 
1 "Burma"     "SingaporeThailandSingaporeBurma" 
2 "Hong Kong" "Hong KongLaoMacauSingaporeTaiwan"
2 "Lao"       "Hong KongLaoMacauSingaporeTaiwan"
2 "Macau"     "Hong KongLaoMacauSingaporeTaiwan"
2 "Singapore" "Hong KongLaoMacauSingaporeTaiwan"
2 "Taiwan"    "Hong KongLaoMacauSingaporeTaiwan"
end
For each `id', I'd like to gather all the countries (Singapore, Thailand, Singapore, Burma for id=1) into a new variable called `all', as shown in the above data set . My code is
Code:
bys id: gen t = _n
reshape wide country, i(id) j(t)
egen all2 = concat(country*) 
reshape long country,i (id) j(j) 
drop if country == ""
drop j
My question is:
  1. Any other (more concise) way to do this?
  2. Is it possible to put a comma between countries in `all' variable?
Thanks in advance.

I can never run Stepwise, always got 'command ssd is unrecognized'

$
0
0
As the title said it. Searched and found no answer. Anyone has any clue how to overcome this? Thousand thanks indeed (dying to be able to use stepwise now)

Somchai

An error "plugin not loaded or not available: use the adoonly option" accur after "ml maximize"

$
0
0
I am trying to learn how to use mdraws by Cappellari and Jenkins.When replicating the example test_trial_dta_100.do,an error accuered after the step ml maximize. everything is fine until: . ml maximize. Error message is "plugin not loaded or not available: use the adoonly option".
Anyone can help me understand why this happen?Thanks a lot.
Viewing all 65609 articles
Browse latest View live


Latest Images

<script src="https://jsc.adskeeper.com/r/s/rssing.com.1596347.js" async> </script>